
How Artist.Tools Got It Wrong
"Likely Bot-free" means the followers look clean. It says nothing about who is actually pressing play.

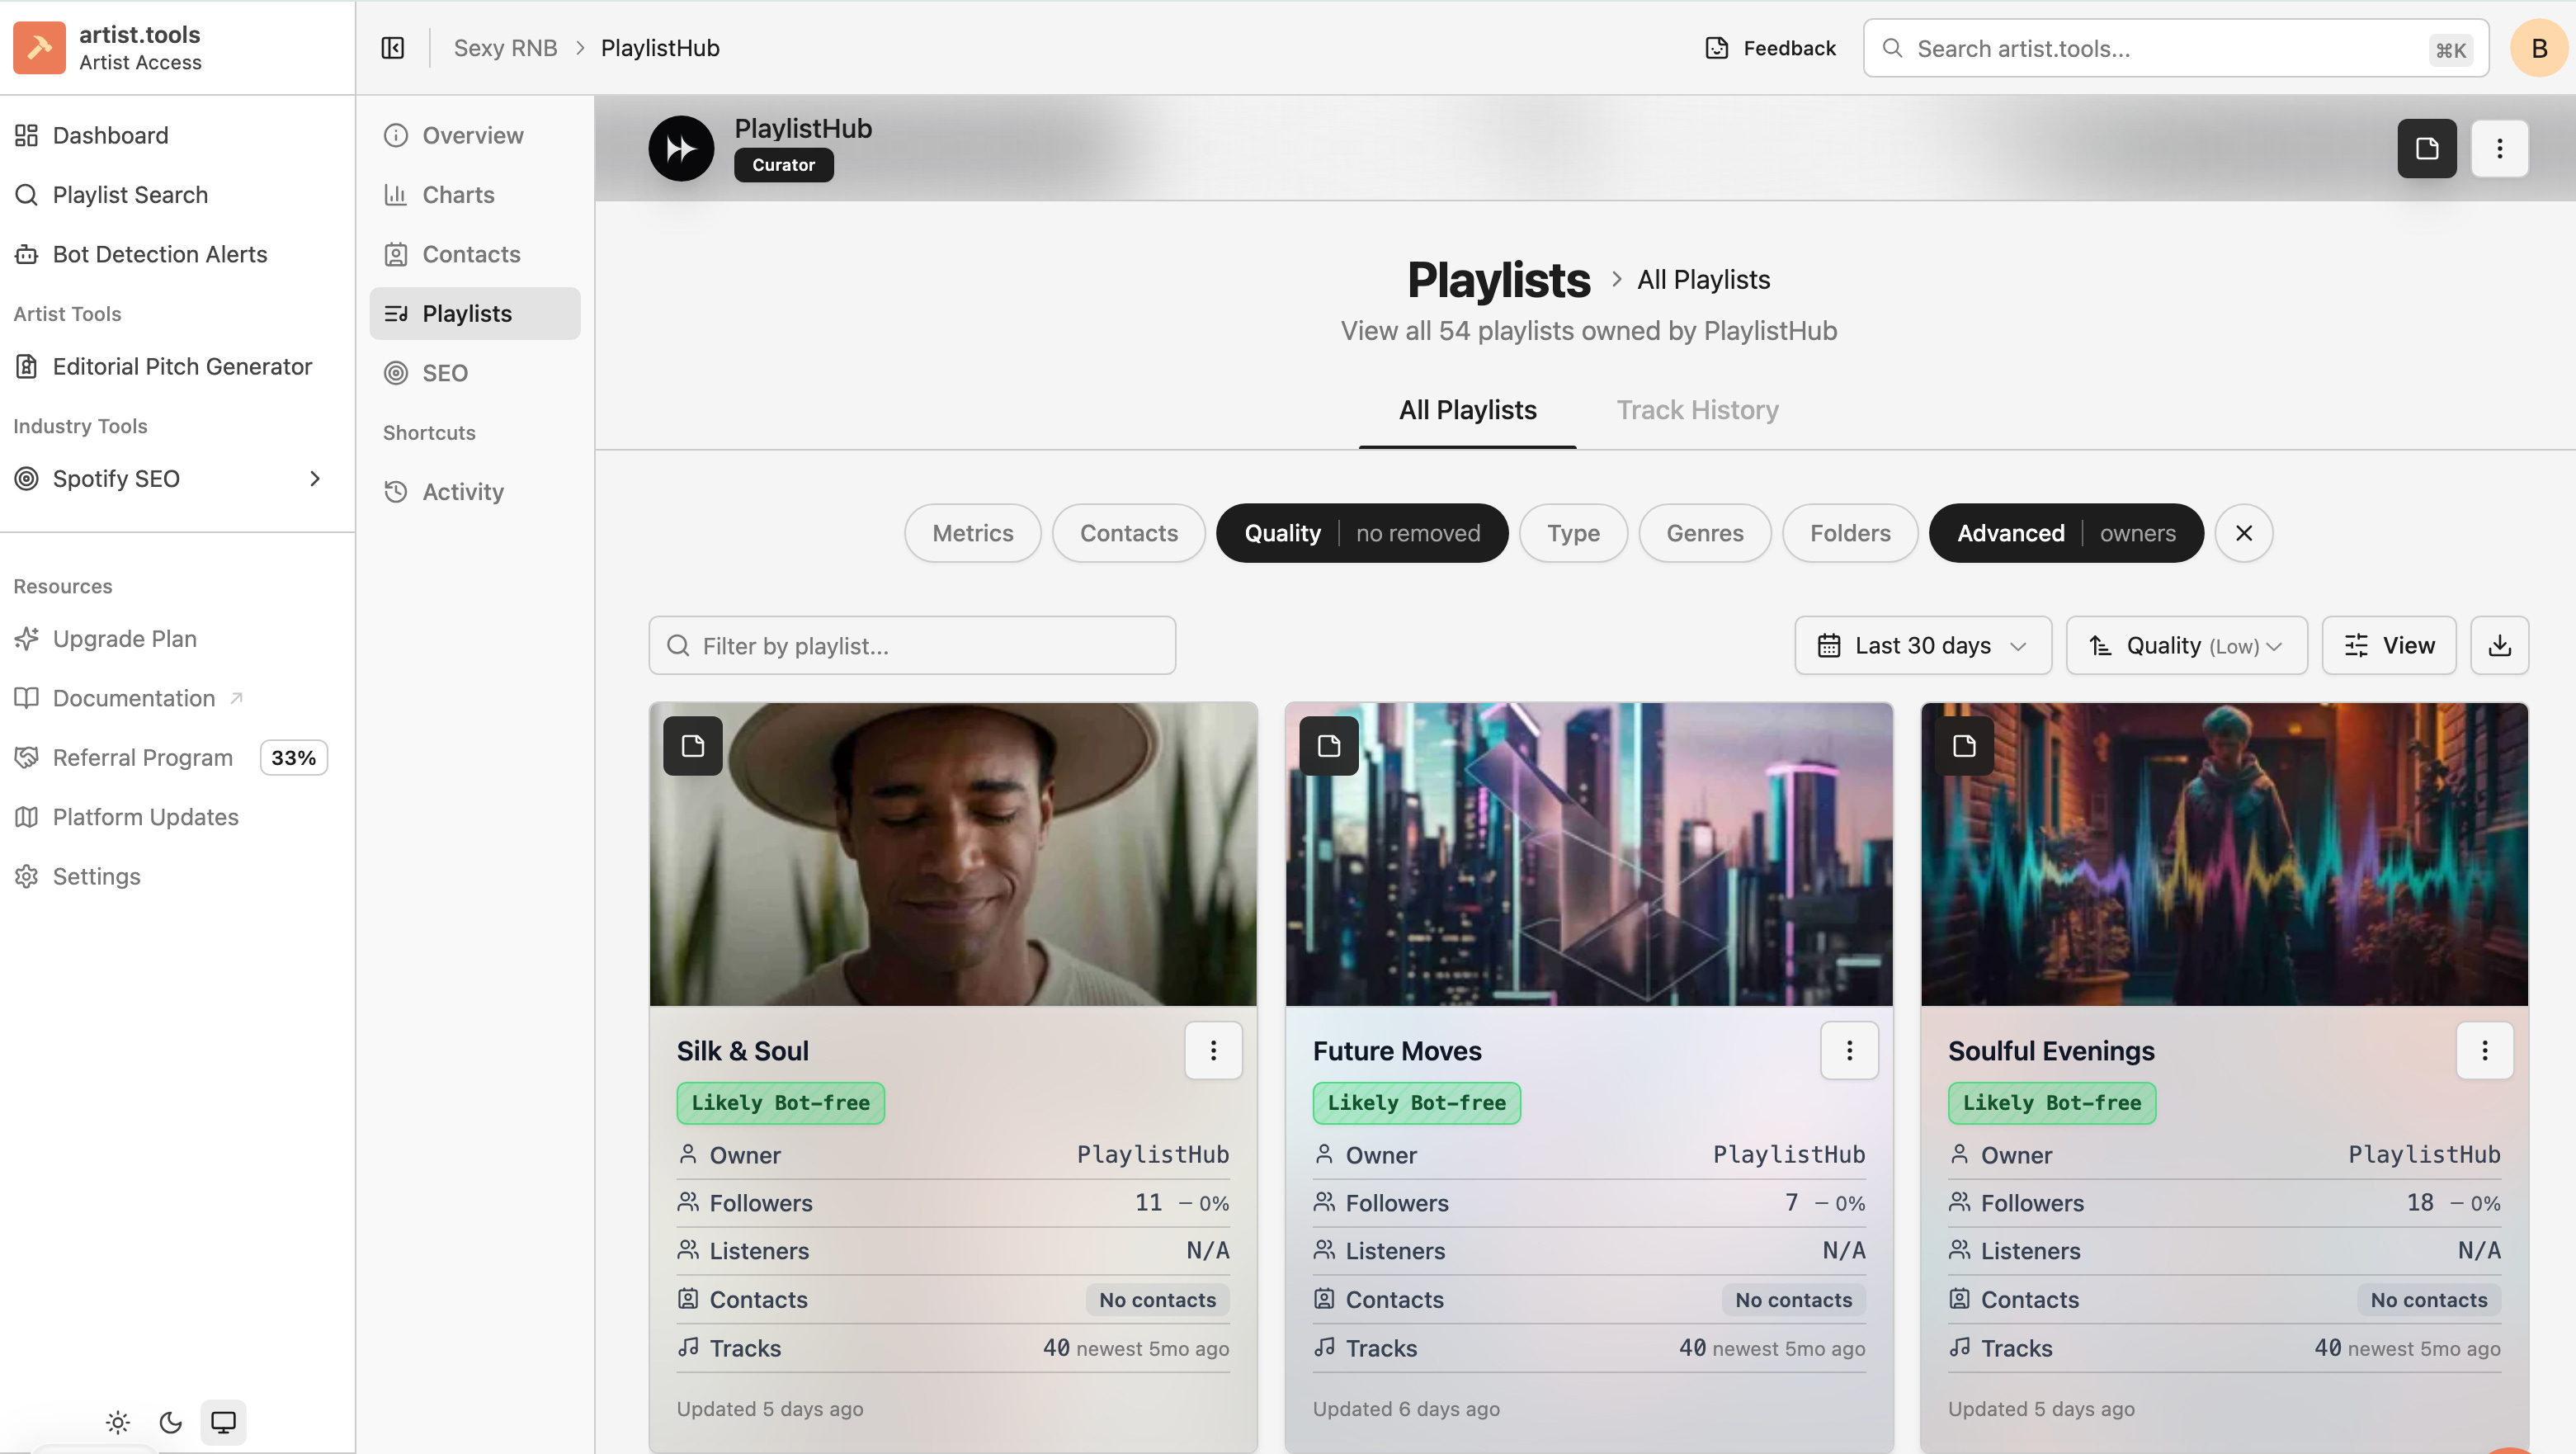
The screenshot is damning in a way that takes a moment to see.
Fifty-four playlists. All owned by PlaylistHub. All flagged “Likely Bot-free” by artist.tools. Followers ranging from 1 to 83. Listener data: N/A across the board. No contacts. Tracks last updated five months ago, yet timestamps showing “Updated 3 days ago.” A conscious soul track placed on a Japanese rock playlist — ロック魂の響き, “Rock Soul” — with 58 followers and a genre match that would make any algorithm wince.
And yet: streams flowed while the subscription was active. The moment the credit card was blocked, the streams stopped. Not gradually. Not over weeks as real listeners moved on. Instantly.
Artist.tools says these playlists are clean. The experience says otherwise. Both things can be true simultaneously, and understanding why is the difference between an artist who gets fooled once and an artist who understands how the game actually works.
What Artist.Tools Is Measuring
Artist.tools is detecting bot followers. It is not detecting bot listeners.
These are different populations doing entirely different things. The followers of a playlist are the accounts that clicked “Follow” at some point. The listeners are whoever is actually streaming the tracks — and those can be sourced from anywhere: a direct link, an API call, a geographic arbitrage campaign, a loop farm running in the background of a server in Virginia.
A playlist with 11 genuine followers can generate thousands of streams if the operator is pointing external traffic at it. Artist.tools cannot see that traffic. It can only see the follower list. When it examines that list and finds no suspicious spike patterns — no 10,000 followers added overnight, no accounts with zero activity — it flags the playlist as “Likely Bot-free.” It is correct about the followers. The question is whether any of them are the ones listening.
“Silk & Soul” has 11 followers. If those 11 people genuinely loved a track and saved it after discovering it on that playlist, they would still be listening after the subscription ended. The streams would decay slowly, the way organic discovery always decays — gradually, over weeks, as the track cycles out of rotation.
That is not what happened.
The Decay Rate: What Zero Means
Forensic analysis of streaming fraud uses a metric called the Decay Rate to distinguish organic from programmatic engagement:

When a track is removed from a real playlist with real listeners, some portion of that audience has already saved the track to their personal libraries. The daily stream count does not fall off a cliff. It decays — typically 10 to 40 percent per day in the period following removal, as the song persists in the tail of actual human behavior.
Programmatic traffic exhibits a Decay Rate of D ≈ -1.0. One hundred percent drop. Not a cliff — a wall. The traffic does not decay because there was never a listener to retain. There was a script. And when the script’s subscription ID was deactivated, the script stopped running.
The streams stopping the instant the card was blocked is not circumstantial evidence. It is the mechanism, visible in the outcome. Real fans do not have access to a billing cycle. They do not collectively decide to stop listening at the moment a payment fails. A Decay Rate of -1.0 is the signature of a command-and-control playback architecture — a centralized system triggering thousands of playback requests that flatlines the moment the operator cuts the feed.
Artist.tools cannot see this. It monitors follower growth charts, not streaming velocity relative to follower count. A five-follower playlist generating five thousand streams in a month is invisible to a tool that is looking for vertical spikes in followers. The playlist looks dormant. The damage it causes is not.
The Clean Bot Paradox
Modern bot operations integrated into SaaS promotion platforms are specifically engineered to defeat heuristic detection tools.
The crude version of botting — adding 10,000 followers overnight, generating a spike that any analytics tool could flag — was defeated years ago. What replaced it is slower and more deliberate. One to five followers added per day across hundreds of playlists. Save rates calibrated to mimic human engagement ratios. Synthetic account profiles built with genre-consistent listening histories, varied daily windows, and followed playlists — behavioral mimicry sophisticated enough that the accounts pass profile-quality checks.
The result is what the industry now calls the slow-burn pattern. The follower chart stays within the expected standard deviation for organic growth. The heuristic tool never triggers a suspicious flag. And the streaming output — delivered through direct API calls that bypass the follower requirement entirely — accumulates quietly while the tool reports everything as clean.
Look at the PlaylistHub data again. Most playlists show tracks “newest 5mo ago” — no new music added in five months — but were “Updated 3 days ago.” The update is not new content. It is a timestamp refresh. The playlist is being maintained as a static landing strip for external traffic while its surface data continues to signal activity. Heuristic tools look for activity. The timestamp provides it. The content behind the timestamp is irrelevant to the detection logic.
This is not a failure of artist.tools. It is the design of the adversary. The 2025–2026 generation of SaaS-integrated fraud was built specifically to stay below the detection thresholds that tools like artist.tools use — because those thresholds are publicly known, and the people building these services read the same documentation everyone else does.
The Geography the Tool Missed
There is a forensic check that does not require access to proprietary data, and it is one of the most reliable indicators of programmatic fraud available to independent artists.
Check your Spotify for Artists listener location data from the period when PlaylistHub placements were active. Look specifically for Ashburn, Virginia and Helsinki, Finland in your top streaming cities.
Ashburn is known as Data Center Alley — the interconnection hub for the eastern United States, home to the world’s largest concentration of cloud computing infrastructure. There is no organic cultural scenario in which Ashburn appears as a top streaming city for an independent conscious soul artist. Its residential population is modest. Its server population is effectively infinite. Thousands of virtual private servers can trigger concurrent playback sessions from that geography, generating listener data that looks like a city but is actually a rack.
Helsinki has emerged as the European counterpart — high-density Google and Equinix infrastructure, high-speed connectivity, and a documented history as a European bot farm hub.
Artist.tools flags cultural centers like Los Angeles — which produces high false positives because LA has both genuine listeners and cloud infrastructure — while frequently missing the surgical, server-concentrated traffic from Ashburn and Helsinki. If either of those cities appeared in the top five streaming locations during the PlaylistHub period, the heuristic tool’s “Likely Bot-free” rating is not just incomplete. It is proven wrong by the geography of the fraud.
The Genre Entropy Problem
There is a second layer of damage that follower-based detection misses entirely, and it is the one that follows artists longest after the subscription ends.
Genre entropy is a measurable property of a playlist. Formally:

Where pi is the proportion of tracks belonging to genre i. A focused, human-curated playlist has low entropy — a coherent genre neighborhood where the algorithm can build confident predictions about listener taste. A grab-bag aggregate network has high entropy — tracks placed by whichever subscriber paid that month, regardless of fit.
ロック魂の響き is a Japanese rock playlist. Conscious soul music placed there does not just fail to find listeners. It generates negative algorithmic signal. Every real listener who reaches that track and skips it is telling Spotify’s model: this music does not belong here. Spotify uses audio analysis — tempo, key, danceability — and collaborative filtering — user-to-user taste overlap — to determine who should hear a track. Repeated association with mismatching genres causes the algorithm to lose confidence in its predictions about that track’s audience.
Artist.tools does not measure genre entropy. A playlist can contain acid jazz and death metal and receive a “Likely Bot-free” rating, because the follower growth chart looked steady. The entropy damage is invisible to follower-based heuristics and visible only in the artist’s declining organic discovery metrics — the track disappearing from Discover Weekly, the Release Radar placements thinning out, the “Fans Also Like” data becoming incoherent.
The skip rates accumulate. The confidence score drops. The algorithm stops recommending the track. None of this shows up in artist.tools. All of it shows up in the artist’s actual career.
What the Tool Would Need to See
The research gap here is not a mystery. Closing it requires four things that current heuristic tools do not do.
First: streaming velocity relative to follower count. A playlist with five followers generating five thousand streams in a month is not a small, sleepy playlist. It is a high-velocity conduit. The ratio is the anomaly, and it is currently invisible to tools that only track follower growth.
Second: retroactive decay rate flagging. Any playlist that exhibits a D ≈ -1.0 drop — streams stopping instantly rather than decaying — should be retroactively flagged and every artist who was placed on it notified. The immediate cessation event is the proof. It arrives after the damage, but it is still recoverable information if the tool captures it.
Third: geographic risk scoring against data center IP ranges. Ashburn, Helsinki, Buffalo — these are forensic markers, not cultural ones. Their presence in a top-five listener city list is not ambiguous.
Fourth: genre entropy audits. A playlist’s internal genre coherence is auditable from public track data. High entropy combined with low follower count and flat growth is the signature of an aggregate network operating below the detection threshold.
The Musinique Indie Playlist Intelligence Engine is being built around churn analysis — tracking how long individual tracks stay on playlists after being added — because the seven-day removal pattern is the billing cycle made visible in track data. That behavioral signature catches what follower growth charts cannot. It is the difference between auditing the front door and auditing what is actually happening inside the building.
What Comes Next
The poisoning has stopped. That is the first and most important fact.
Spotify’s model of your audience was built on months of data that included skip events from Japanese rock listeners, geographic signals from server farms, and streaming velocity that no eleven-person follower list could organically generate. That model does not reset overnight. But it does reset, as real listener data accumulates — saves, replays, organic adds to personal playlists — and begins to outweigh the noise.
Check the S4A geography. If Ashburn or Helsinki are in your top cities, document it. That is the proof the heuristic tool could not provide, and it belongs in the record of what happened.
The music that generated 1.28 million YouTube views — without a subscription, without a Sassify LLC contract, without a playlist with eleven followers — does not need a Spotify popularity score of 5 to be found. It needs the algorithm to stop routing around it.
That process has started. The decay rate is correcting. The entropy is clearing.
The score was never yours. The music is.
Tags: artist.tools false negative bot detection, decay rate streaming fraud forensics, genre entropy playlist metadata poisoning, Ashburn Virginia data center streaming fraud, Musinique Indie Playlist Intelligence Engine
#MusiqueAI #HumansAndAI #AIMusic #IndieMusician #MusicResearch #GhostArtists #AIforHumans #OpenSourceAI
<iframe width=”560” height=”315” src=”
title=”YouTube video player” frameborder=”0” allow=”accelerometer; autoplay; clipboard-write; encrypted-media; gyroscope; picture-in-picture; web-share” referrerpolicy=”strict-origin-when-cross-origin” allowfullscreen></iframe>
<iframe data-testid=”embed-iframe” style=”border-radius:12px” src=”
width=”100%” height=”352” frameBorder=”0” allowfullscreen=”“ allow=”autoplay; clipboard-write; encrypted-media; fullscreen; picture-in-picture” loading=”lazy”></iframe>